Notes on IESO Supply/Demand outlook to 2035
This post originally appeared on my tumblr account last Friday night.
I’ve flipped through a slide deck Ontario’s electricity system operator, the IESO, has posted prior to insiders meeting March 23rd to discuss how the market should be manipulated in the future.
I’m going to run off some comments on the Preliminary Outlook and Discussion: Ontario Supply/Demand Balance to 2035 slides here.
That first point may sound flip, but if anybody detects a hint of the implication a market signal could trigger economic actors to enter, or exit, the market for electricity generation in the province, please let me know. For me the headline is this is a central planning document which would go nicely with a call to return to a unified public Ontario Hydro model.
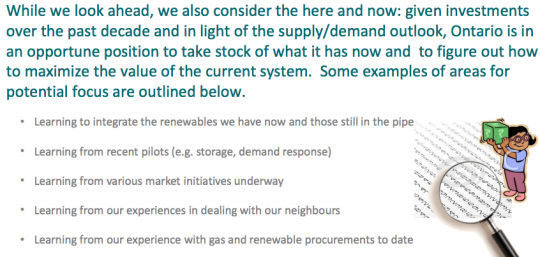
After 14 years Ontario neither has a competitive market nor does it demonstrate any learning of what that is and how it might be accomplished.
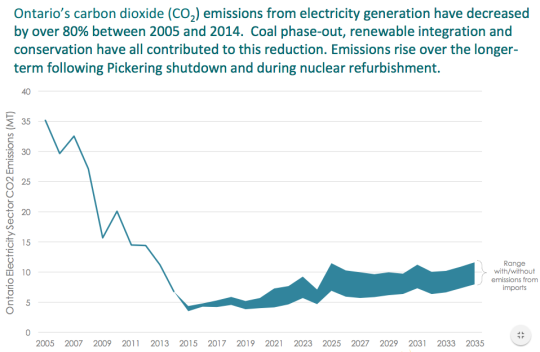
First, for no particular reason, I’ll note slide 23 - which struck me due to its display of possible emissions, including those from imports. Ontario almost exclusively imports from essentially emissions-free Quebec. In addition to today’s healthy trade, anti-nuclear activists continue to tout Quebec imports as an option to replace the Darlington Nuclear Power Plant. I’ve written Ontario's electricity future isn't this Quebec Diversion, and this chart indicates the IESO is open to imports from elsewhere to meet much smaller needs than Darlington’s closure would necessitate.
The IESO’s slides include: “The projection for long-term electricity demand growth is effectively flat:
demand growth is expected to be offset by conservation savings.” Over 5 years ago I wrote, “there is a long trend (60 years) of a slowing in the increase in demand which has transitioned to a decline in Ontario.” Demand is as I expected it without the spending over $300 million a year on a bureaucracy championing “conservation.” I have no reason to think Parkinson’s Law isn’t driving that spending.
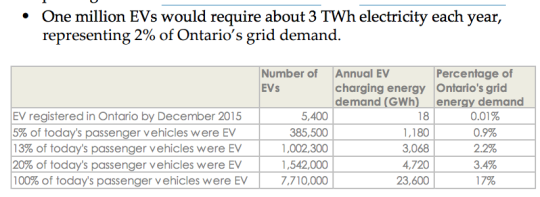
The IESO slides show 1 million electric vehicles “would require about 3 TWh electricity each year,
representing 2% of Ontario’s grid demand.”
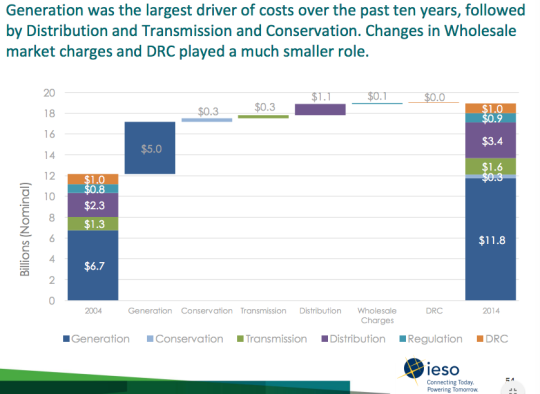
I noticed slide 52 shows costs increased $3.9 billion from 2005 to 2014. While not strictly comparable, this is a strikingly similar number to the total costs of the coal exit, and separate renewables increase, I calculated in The cost of ending coal-fired generation, and renewables, in Ontario.
Slide 54 shows the annual cost of distribution has risen far greater than the cost of transmission - which has risen only as much as the conservation cost.
Smart?
The slidedeck notes the Niagara Area Transmission Reinforcement “investment”, listing drivers as “inter-connections” and “Renewables Generation.” I note it as a reminder of the insult that is the Niagara Region wind project - and other wastes.
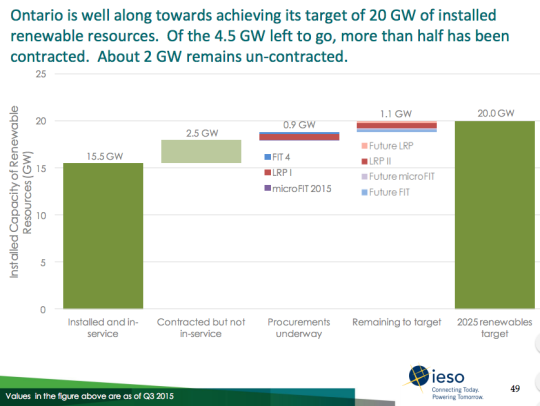
One reason the document gives no indication a market could be relevant to adding/removing supply is they still have government directives to fulfill - by contracting more unnecessary supply.
The journey is already advanced enough to put Ontario’s electricity exploits into the framework of evolution.

[…] operator”, has been studying a lot of things while doing a lot of other things. An outlook to 2035 indicated they plan on doing a lot of learning in the future based on all the data they’ll […]
ReplyDelete